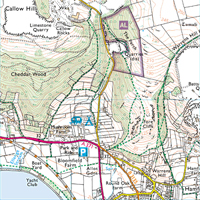
Mapping - Scale

Reproduced by kind permission of the Ordnance Survey. MC 99/91
Introduction
To be useful the map has to show features in real life proportionately smaller than they really are, else you would end up with a life-size map and that would be a waste of time! The proportion that is chosen for the map is called its scale.
It is important to know how to read a map when you are camping, or in the wilderness, so you do not get lost. Camping gear will sometimes provide a compass, but the real Scout leader will know how to read and use a map.

Aqua 3 Maps
Weatherproof, Tough & Durable, Anti-glare, Write on/Wipe off, Lightweight AQUA3®
Free Post & Pack
Aqua 3 sell special all weather maps. These are coated with a special waterproof material and prove to be very useful in the poorest of weathers.

Get 10% off all Ordnance Survey Maps and free UK Postage & Packaging on all OS Maps orders
Scale
The scale indicates the relationship between a certain distance on the map and the distance in real-life. The scale is usually found on the edge of the map and in the legend box (the part which explains all the details of the map and defines the symbols shown on the map).
Sometimes the scale may be spoken of in terms of a representative fraction (RF). It is just a ratio.
For example a scale of 1/10 000 or 1:10 000 means that one centimetre on the map actually represents 10 000 centimetres in real life.
The unit (e.g. cm or metres or inches) you choose to measure in does not matter although modern maps almost always use metric units. I suggest you get used to metric units.
You will often find the scale expressed in words too. Something like
"One centimetre equals ten kilometres"
Large scale maps usually refer to a very detailed map covering a small area. Below are some of the common Ordnance Survey (UK) maps that are used.
- Orienteering 1: 15 000 so 1 cm = 150 m (Useful for detailed information on the local area)
- Outdoor Leisure/Explorer 1:25 000 so 1 cm = 250 m (Very similar to Landranger showing more detail of tourist information. Gives a more 'zoomed in' look at the area. Useful for local hikes.)
- Landranger 1:50 000 so 1 cm = 500 m (All purpose maps covering an area of 40 km by 40 km)
- Travel Master 1:250 000 and 1:625 000 so 1 cm = 2 500 m (useful for planning (road) routes from town to town. It only takes nine of them cover almost the whole of Britain. Useful for car journeys)
- Touring 1:63 360 or 1:158 400 or 1:100 000 or 1:500 000 (Cover popular holiday and tourist areas. Places to see on a day out for example.)
- Maps of the world may have scales like 1: 100 million so 1 cm = 10 km
So for instance, and Explorer map would show more detail than a Landranger map because 1 cm on the Explorer map covers a much smaller area in real life so you don't 'waste' information by having to squash it all into a little box, the information is more 'spread out'.
You have to be very careful in using the scale on the map. It would be pointless knowing the ratio if you are looking at a portion of a photocopied map. What happens if the photocopy had been enlarged or shrunk? Perhaps one cm on the photocopy is not the same as 1 cm on the map. There are several ways round this. If the photocopy shows the grid lines clearly then you will know that on a Landranger Map each grid square represents a 1 km by 1 km area of land. This is equivalent to having a graphical scale.
If you look at the bottom of the map and in the legend you will find a graphical scale. It looks like several rulers laid together. On most Ordnance Survey maps it will consist of two lines. One line has intervals marked in km and one line has intervals marked in miles.
To use this graphical scale choose which one you are going to use first. Now take a ruler and measure the distance between the two places you are interested in on the map. (If the distance is curved e.g. how long a road is, then trace out the route using a find piece of string and mark the ends. Then straighten your string out like a ruler and continue). Now take the ruler and compare it with the graphical scale by laying it alongside. You should be able to tell the true length in real life.
Indeed if you know the stated scale (e.g. 2 cm = 1 km) then simply look at your ruler and change it into the 'real life' distance. If you have measure the distance between two peaks as being 3 cm then this would correspond to a distance of 1.5 km in real life. Beware that this will not work if the map scale has changed (e.g. if the map has been reproduced to a different size) which is why the graphical method is so useful.
I suggest that whenever you reproduce a map you ensure that the graphical scale is reproduced too. Make sure you photocopy the scale at the same time.